I just picked up a license for the fantastic OmniGraphSketcher application. I'm using it to build the visualizations for my thesis, and wanted to see what it would do with my bike tracking data. OK. I was procrastinating, and couldn't force myself to work on the thesis. But, at least I'm learning how to do more cool stuff with data, right? cough
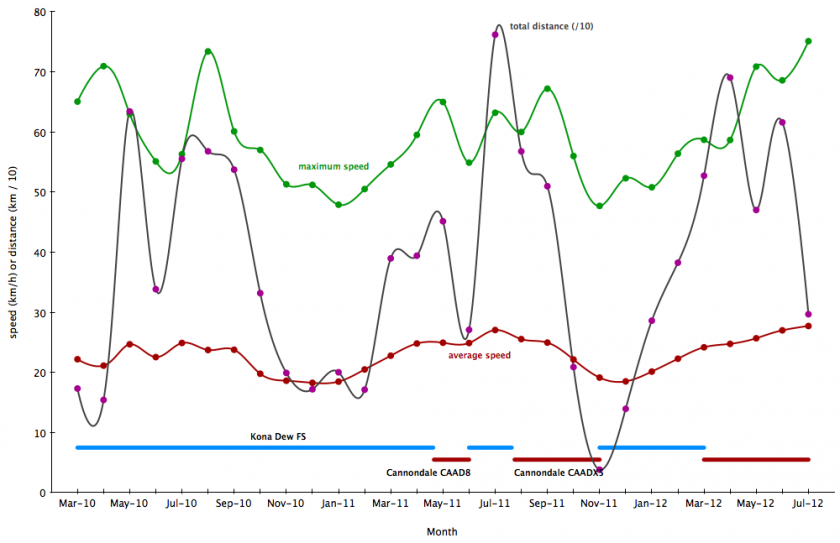
Anyway. Here's a visualization of almost 2 and a half years of data stored in Cyclemeter on my iPhone. I exported the activity history in monthly aggregate, and took the .csv file into Excel to select the rows, which were then pasted into OmniGraphSketcher. The visualization shows total distance (divided by 10, so the distance data points fit in the same range as speed data), average speed and maximum speed per month. I also overlaid lines to show which bike was being used. The Kona wound up being my winter bike, and my Cannondale is my fast summer bike. It's pretty easy to see where the snow and ice crapped up my rides :-)
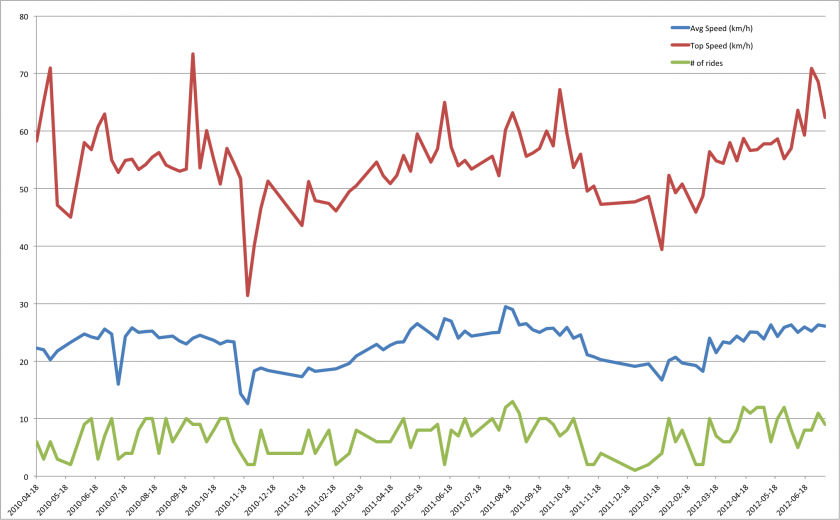
compare the OmniGraphSketcher graphic above, with one I created directly in Excel back in July:

