line goes up
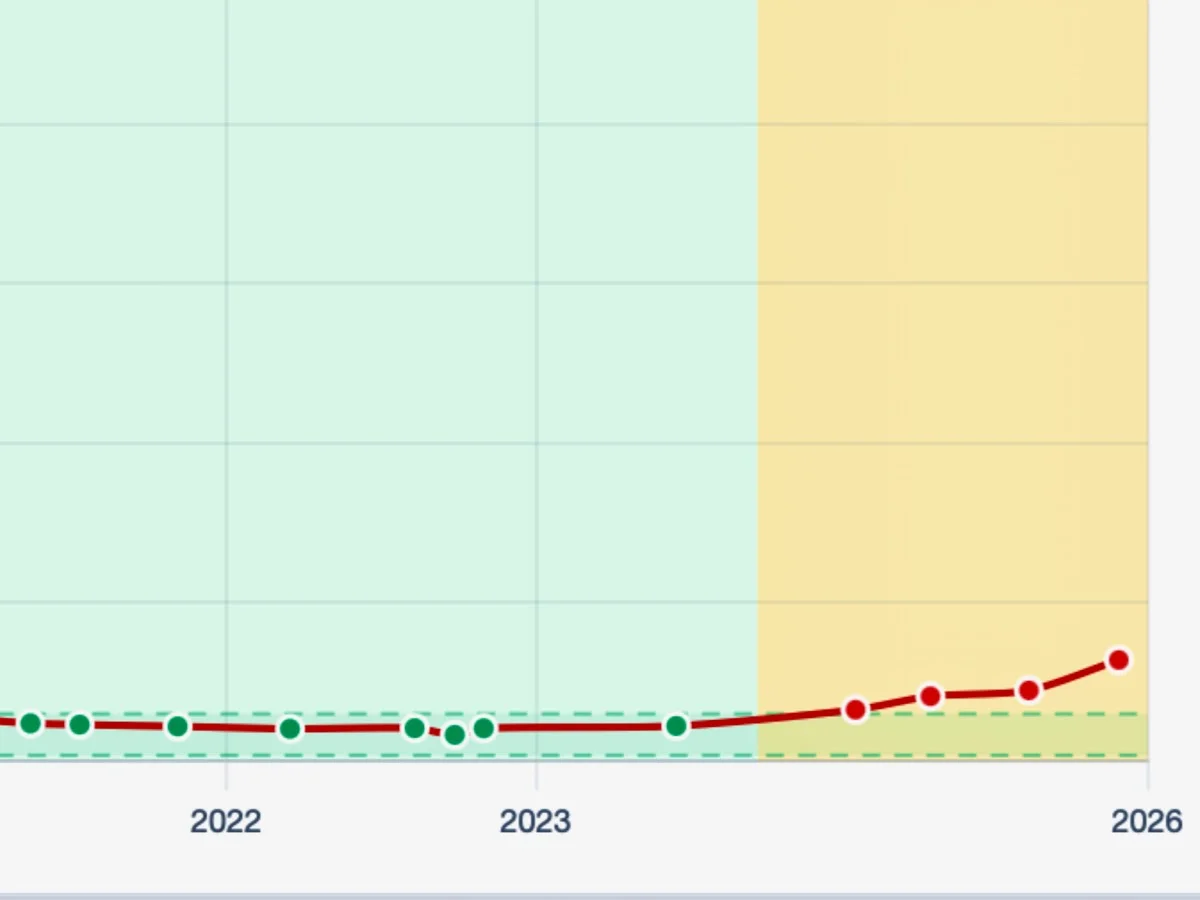
A line chart showing a metric that remains flat and stable within an acceptable range (shown in green) from 2022 through mid-2023, then rises sharply upward into a warning zone (shown in yellow) approaching 2026, with data points transitioning from green to red markers.
Photo by D'Arcy Norman