performance overview
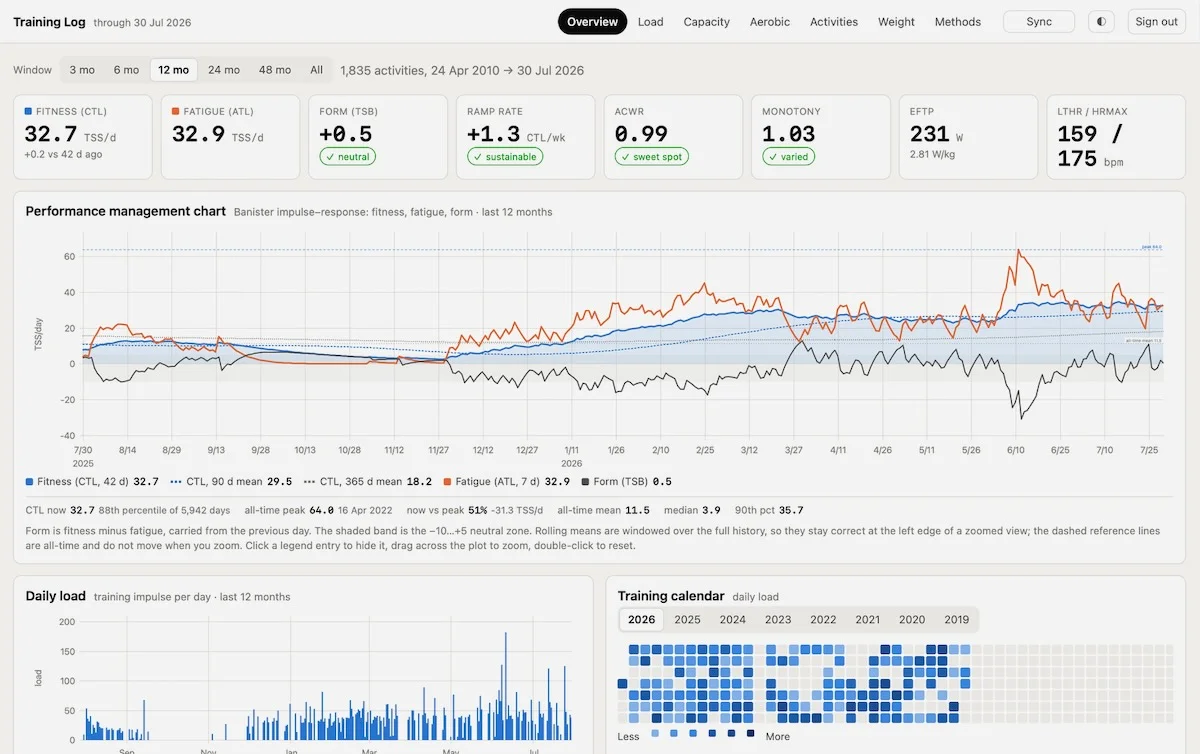
A training log dashboard displaying an athlete’s performance management chart with fitness, fatigue, and form metrics tracked over 12 months, alongside daily load graphs and a training calendar heatmap. Key statistics include CTL fitness of 32.7, ATL fatigue of 32.9, and various training metrics like ACWR and ramp rate.
Photo by D'Arcy Norman