one week in the vault
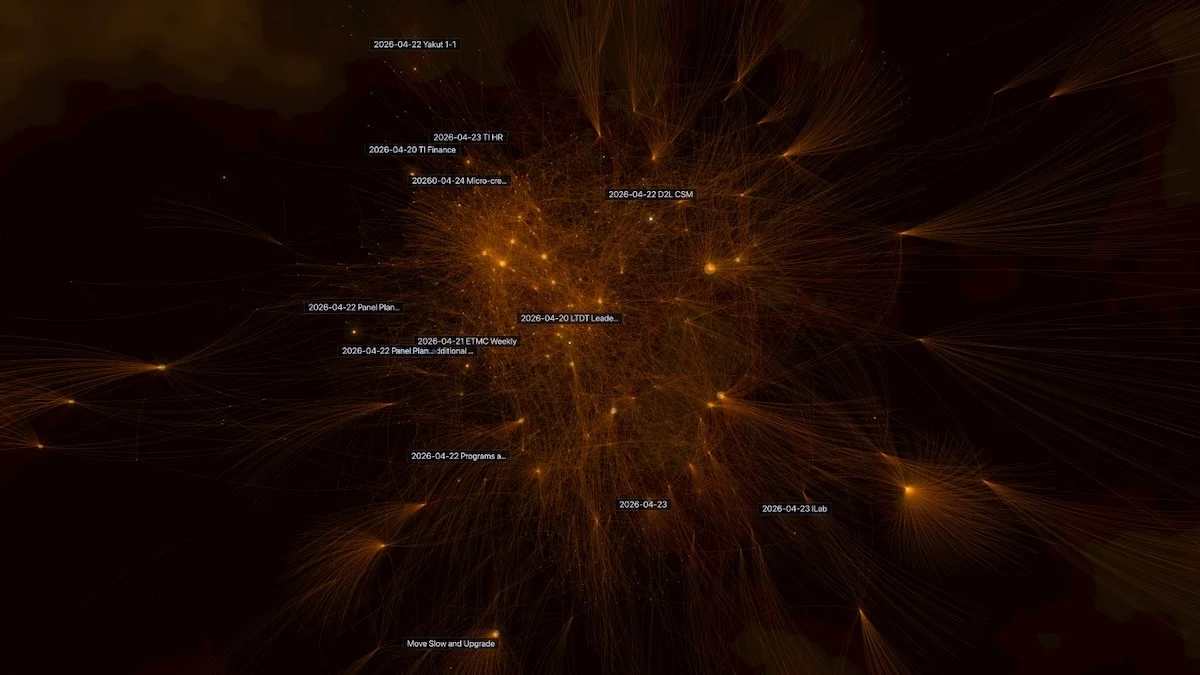
A network visualization showing interconnected nodes and data points from April 2026, with golden/orange lines radiating outward against a dark background, resembling a complex system map or knowledge graph.
Photo by D'Arcy Norman