I’ve been playing around with some ideas for visualizing the notes and connections in my Obsidian vault, and how to go beyond just producing pretty pictures and into something that might be useful to make sense of the whole thing. It’s not quite there yet, but it’s getting close. Vibecoding this with Claude Code has let me take some ideas I’ve had for years, and actually building a thing in a couple of hours.
Here’s a 30-second timelapse of my notes, sorted by date created. The first notes that show up are related to my MSc and PhD programs, and then it really starts to fill in once I started using Obsidian for everything back in 2022.
I’m working on more tools to filter the nodes (by date, tag, folder), as well as being able to select a single note and visualize its connections (over a number of “hops” to the rest of the graph).
Here’s the graph subset based on the “UCalgary Microcredentials Framework” note, +2 hops:
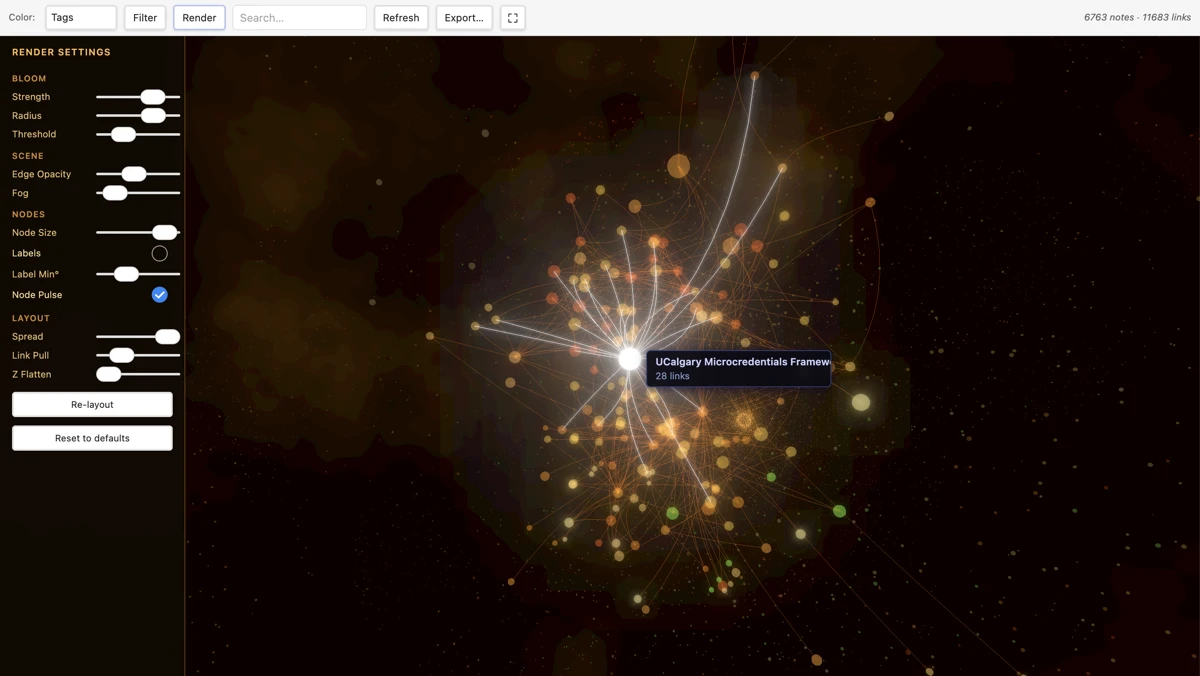
Screenshot of the Graph Render Obsidian plugin
Rendering setting panel open to the left, with UCalgary Microcredentials Framework note selected and notes up to 2 hops away displayed.
Image by D'Arcy Norman
The plugin uses WebGL and is hardware acceleration enabled. The initial layout takes a couple of seconds, and then it’s a fully interactive 3D graph environment.
From Claude’s Readme notes:
AI-Generated Content via Claude Code (Sonnet 4.6)
3D Graph Render — Obsidian Plugin
A hardware-accelerated 3D visualisation of your Obsidian vault’s note graph. Built on Three.js + WebGL, routed through Metal on macOS for full GPU acceleration. Renders in a Galaxy aesthetic: deep-space amber nebula, glowing clustered nodes, and flowing curved edge filaments.
Features
Rendering — Galaxy Style
- 3D force-directed layout — d3-force-3d simulation runs inside the animation loop and self-organises automatically; watch the graph settle in real time
- Instanced rendering — single GPU draw call for all nodes regardless of vault size
- Additive bloom — nodes use additive blending so dense clusters self-brighten into hot white cores; UnrealBloomPass adds soft halos
- Procedural nebula background — a full-sphere FBM (fractional Brownian motion) GLSL shader renders animated amber/orange gas clouds behind the graph
- Curved Bezier edges — at layout convergence, straight edges are replaced by 8-segment quadratic Bezier curves with a perpendicular bow, giving a galactic-arm filament appearance
- Clustered particle haze — 6 000 warm golden particles concentrated near the graph centre via power-law radial distribution
- Cluster-coloured nodes — coloured by tag group or folder; all nodes get a colour via deterministic hashing (nothing appears grey)
and
AI-Generated Content via Claude Code (Sonnet 4.6)
Filters (Filter button → right panel)
All filters use a Seed + Expand model: matching notes are seeds (full size/brightness), their direct neighbours are shown at reduced size/brightness, everything else fades to near-invisible.
| Filter | What it does |
|---|---|
| Date | Seeds = notes created or modified within last day / week / month / year |
| Tags | Seeds = notes containing any of the selected tags (checkbox list, top 50 by frequency) |
| Folder | Seeds = all notes inside the selected folder |
| Starting note | Seeds = a specific note + its N-hop neighbourhood (hop depth 1–5) |
Filters compose: all active conditions are unioned into one seed set.
A match count at the bottom of the panel shows N matches · M neighbors.
Note on date filters: “Modified” reflects the file system
mtime, which is updated by sync tools (iCloud, Obsidian Sync, Dropbox) even without manual edits. Use a tighter range (Last day) for precise results.
Search
Type in the Search box for real-time highlighting:
- Matching nodes glow bright yellow and grow 50% larger
- Non-matching nodes shrink and dim to near-invisible
- Matches on note name, tags, and folder path